

Jul 10, 2026
What is OEE? Meaning, formula and how to calculate OEE
What does OEE mean and how do you calculate the OEE score? Read how availability, performance and quality together determine how effective your production is.
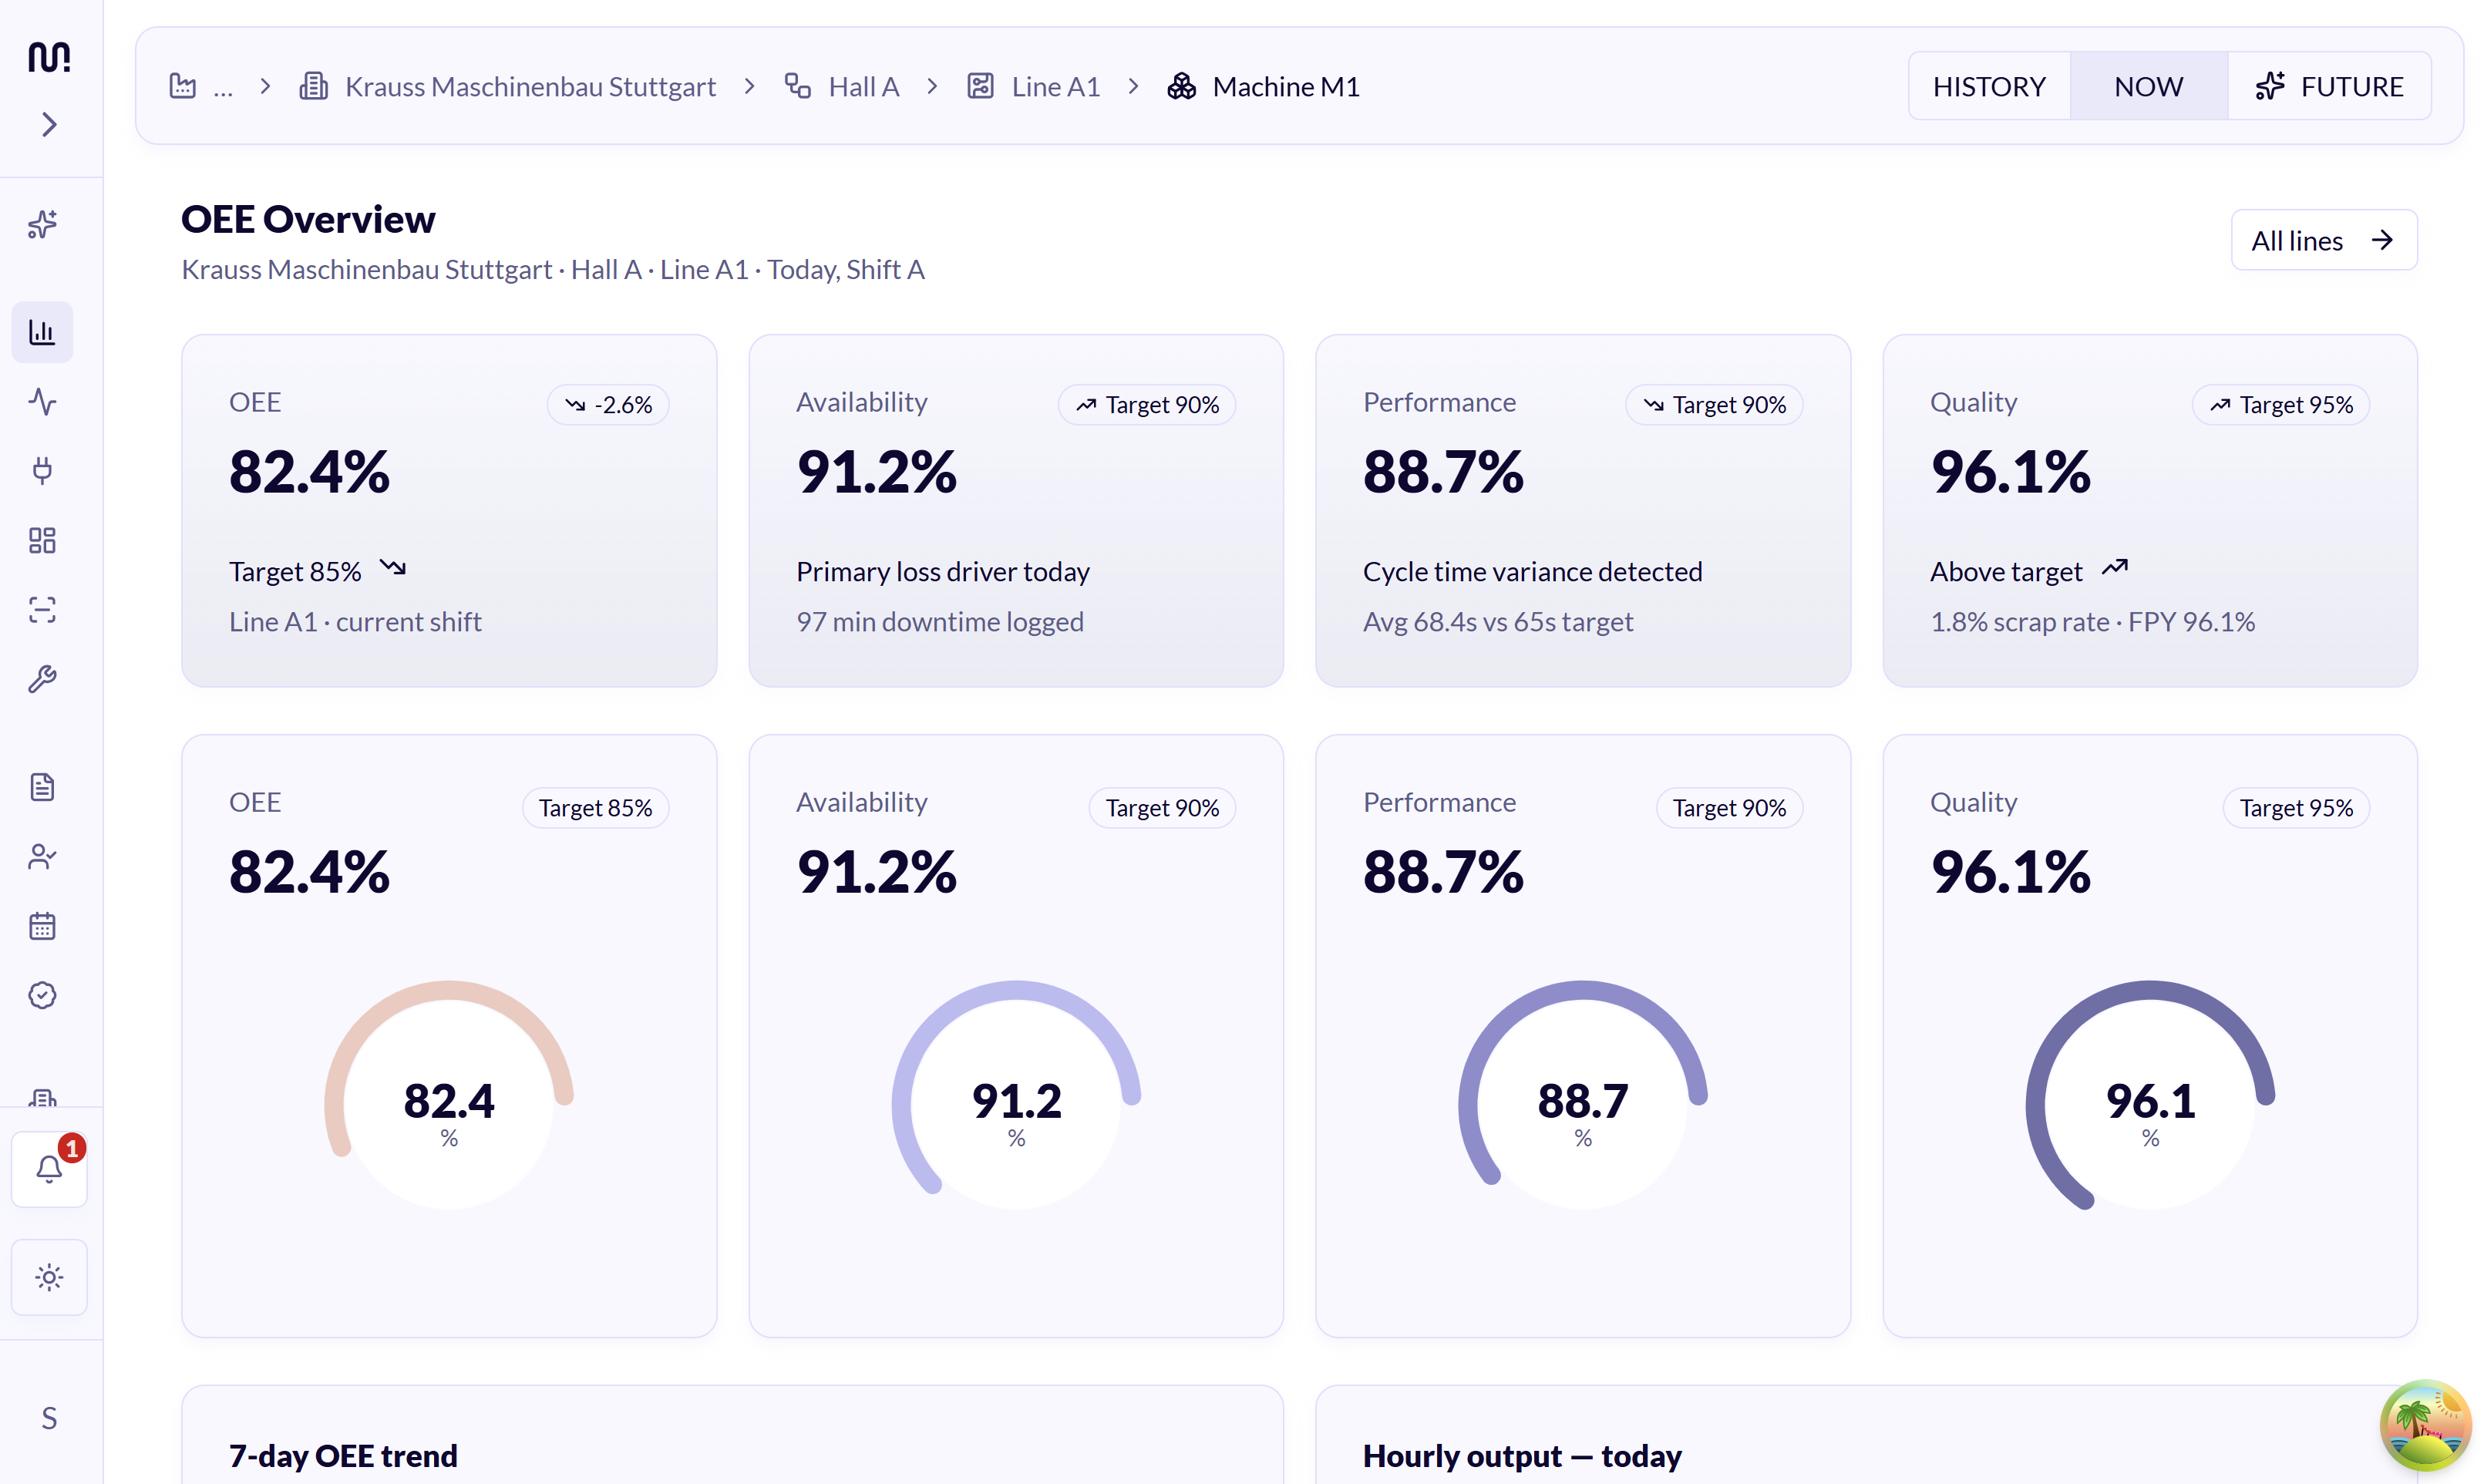
What is OEE?
OEE shows how effectively a machine or production line uses its planned production time. The score combines three components: availability, performance and quality. This means you see not only how much was produced, but also how much production time was lost due to downtime, speed loss and rejects.
In this article, we explain what OEE means, which formula to use, how to calculate your OEE score and, most importantly, how to use the result to make targeted improvements.
OEE meaning: what does OEE stand for?
OEE stands for Overall Equipment Effectiveness. In simple terms, it describes the overall effectiveness of a machine or production installation. The method is used to show how much of the planned production time is actually used productively.
An OEE score of 100% theoretically means that a machine runs during all planned production time, produces at its ideal speed and only produces good-quality products. In practice, there will always be losses. OEE helps divide those losses into different categories and makes them easier to discuss.
The value of OEE therefore lies not only in the percentage itself. The three components behind the score show where production capacity is being lost and where the biggest opportunities for improvement can be found.
The three components of OEE
The OEE formula consists of availability, performance and quality. Each component measures a different type of production loss.
| Component | What does it measure? | Typical losses |
| Availability | How much of the planned production time the machine is actually running. | Breakdowns, longer stops, changeovers and waiting for materials. |
| Performance | How fast the machine runs compared with the agreed or ideal speed. | Microstops, reduced line speed, longer cycle times and short interruptions. |
| Quality | What percentage of total production meets the quality requirements first time. | Rejects, rework and products that need to be produced again. |
1. Availability
Availability shows how much of the planned production time the machine actually operated. If a production line is scheduled for 400 minutes but is stopped for 40 minutes due to breakdowns and changeovers, 360 minutes of runtime remain.
Availability losses can be caused by breakdowns, material shortages, waiting for an operator, cleaning or changeovers. You should clearly define beforehand which stops are and are not included. Otherwise, OEE scores between production lines or shifts become difficult to compare.
2. Performance
Performance looks at production speed during the time the machine is running. A machine can technically be operating while still losing production capacity because the cycle time is longer than normal, the line is running below its target speed or frequent short microstops occur.
For a reliable performance calculation, you need a realistic ideal cycle time or ideal production speed. An outdated standard can artificially increase or decrease the score.
3. Quality
Quality shows what percentage of the products produced are correct the first time. Rejects and rework therefore count as quality losses.
If you produce 1,000 products and 980 meet the requirements immediately, the quality score is 98%.
What is the OEE formula?
The standard OEE formula is simple:
OEE = Availability × Performance × Quality
The three percentages are calculated separately and then multiplied. This means that relatively small losses across several components can have a significant impact on the total OEE score.
Suppose availability is 90%, performance is 95% and quality is 98%. The OEE is:
0.90 × 0.95 × 0.98 = 0.8379, so an OEE score of 83.79%
An OEE score of 83.79% does not mean that the machine was stopped for 16.21% of the time. The losses may be spread across downtime, reduced speed and quality losses. That is why it is important to always look at the three individual components behind the total score.
How to calculate OEE in 4 steps
You can calculate OEE yourself using a few basic production figures. Below, we use a simple example from one production line during a shift.
Production data from the shift
- Planned production time: 400 minutes
- Total downtime: 40 minutes
- Actual runtime: 360 minutes
- Ideal cycle time: 1 minute per product
- Total products produced: 342
- Good products: 335
Step 1: calculate availability
Availability = runtime / planned production time
360 / 400 = 0.90, so availability is 90%
Step 2: calculate performance
Performance = (ideal cycle time × total products) / runtime
(1 minute × 342) / 360 = 0.95, so performance is 95%
Step 3: calculate quality
Quality = good products / total products
335 / 342 = 0.9795, so quality is 97.95%
Step 4: calculate the OEE score
0.90 × 0.95 × 0.9795 = 0.8375, so the OEE score is 83.75%
The final score alone does not tell you exactly where the remaining 16.25% of production capacity was lost. The underlying figures do. In this example, availability is the lowest component at 90%. That makes it a logical starting point for further investigation.
What is a good OEE score?
There is no universal definition of a good OEE score.
An OEE score of 85% is often mentioned as a so-called world-class benchmark for discrete manufacturing. This can provide a useful reference point, but it is not automatically the right target for every factory, production line or process.
A production line with frequent product changeovers, for example, has a different starting point from a line that produces the same product for several days. The way planned downtime, changeovers and ideal production speed are defined also affects the score.
OEE is therefore most useful when comparing your own performance consistently: the same production line, the same definitions and the same measurement method. If a production line improves from 58% to 64% because a recurring production loss has been eliminated, that can be more valuable than simply targeting a general benchmark without considering the context.
What does a low OEE score mean?
A low OEE score means that part of the planned production capacity is being lost. The total score does not yet tell you why. Start by checking which of the three OEE components is performing poorly.
| If this is low | Look at first | Examples |
| Availability | Longer downtime and stop reasons | Breakdowns, changeovers, material shortages |
| Performance | Speed losses and microstops | Reduced line speed, short interruptions, longer cycles |
| Quality | Rejects and rework | Process deviations, start-up losses, defective products |
Is availability the biggest problem? Then it is often useful to start by automatically recording and classifying machine stops. Also read more about production downtime monitoring. Is quality the component that lags behind? Then root cause analysis with production data is the logical next step.
The Six Big Losses behind OEE
Within OEE, production losses are often linked to the Six Big Losses from TPM. This framework helps you move from a percentage to specific causes.
- Breakdowns: unplanned downtime that reduces availability.
- Setup and adjustments: time during which the production line is not producing because of changeovers or machine settings.
- Small stops: short interruptions that are often not considered full breakdowns but together can account for significant production losses.
- Reduced speed: the machine is running, but below its ideal or agreed speed.
- Start-up losses: rejects or reduced output during start-up, setup or warm-up.
- Production rejects: products produced during normal operation that do not immediately meet the required quality standard.
You do not need to measure all six losses perfectly from day one. Start with the losses that are already visible and can be influenced. Once the basic measurement is reliable, you can gradually improve the level of detail.
Why manually calculating OEE often has limitations
A first OEE calculation can easily be made in Excel. The challenge starts when OEE needs to be used every day to manage production. Data from different sources then needs to be recorded on time and in the same way.
Common problems include:
- Stops are only entered after the shift and stop reasons are missing.
- Microstops are not recorded because no one can realistically keep track of every short interruption manually.
- Production quantities and rejects come from a different system than machine status.
- The ideal cycle time is outdated or varies by product.
- Different shifts use different definitions for the same type of stop.
- The OEE score is only available the next morning, when it is already too late to adjust the current shift.
As a result, an OEE dashboard may look accurate while the underlying data is not reliable enough to support decisions. Clear definitions and consistent data collection are therefore at least as important as the formula itself.
Automatically measuring OEE with machine data
Much of the information needed to calculate OEE is already available in machines, PLCs and existing production systems. This can include machine status, production quantities, cycle times, fault codes, stops and sometimes quality data. By connecting these data sources, much of the OEE calculation can be automated.
This has three main advantages:
- The same measurement method is used during every shift.
- Short stops and speed losses that are easily missed manually become visible.
- The OEE score and the causes behind it are available during production instead of only afterwards.
With the live OEE dashboard from Meshnex, availability, performance and quality can be displayed per machine, production line or shift. MeshOS reads available data from existing PLCs and other data sources. The exact setup depends on the machines, products and information already available.
How can you improve OEE?
Improving OEE does not start by simply trying to increase the total percentage. Start with the largest measurable production loss. This prevents teams from working on ten different causes at the same time without knowing which improvement will have the biggest impact.
- Create a reliable baseline. Measure the same machine or production line across several shifts using consistent definitions.
- Determine which OEE component is underperforming. Is availability, performance or quality responsible for the largest loss?
- Make the causes visible. For example, divide downtime into breakdowns, changeovers, material shortages and microstops.
- Address one recurring loss. Choose a cause that occurs frequently or results in a significant amount of lost production time.
- Measure the effect. Compare the score and the underlying losses before and after the change.
- Repeat. Once the first loss has been reduced, shift your attention to the next bottleneck.
This turns OEE from a simple performance score into a consistent method for supporting production improvements.
Why the OEE score alone is not enough
Two production lines can have exactly the same OEE score while experiencing completely different problems. One line may suffer from significant downtime but produce almost no rejects. Another may run almost continuously but operate too slowly and experience more quality losses. The final percentage is the same, but the solution is not.
That is why context matters. Combine OEE with stop reasons, machine status, alarms, cycle times, product type and shift information. This makes it possible to see when the score changes and what was happening in production at that moment.
A platform such as MeshOS brings this production data together in a single data layer. This means you can not only monitor OEE, but also use the same data later for applications such as downtime analysis, automated shift reporting and predictive maintenance.
Frequently asked questions about OEE
What does OEE mean?
OEE stands for Overall Equipment Effectiveness. The score shows how effectively planned production time is used based on availability, performance and quality.
How do you calculate OEE?
First calculate availability, performance and quality as percentages. Then multiply the three results: OEE = Availability × Performance × Quality.
What is a good OEE score?
There is no universal good OEE score. An OEE of 85% is often mentioned as a benchmark for discrete manufacturing, but the most important thing is to use the same measurement method consistently and improve both the score and the underlying production losses over time.
Can an OEE score be higher than 100%?
With a correctly configured calculation, OEE should not exceed 100%. If it does, the ideal cycle time, standard production capacity or another input value is usually configured incorrectly.
What is the difference between OEE and production efficiency?
Production efficiency can be calculated in different ways. OEE uses a fixed structure based on three factors: availability, performance and quality. This means you see not only the final result, but also which type of production loss is affecting the score.
Can OEE be measured automatically?
Yes. If machine status, production quantities, cycle times and quality data are available, a large part of the OEE calculation can be automated. Which data can be collected automatically depends on the machine and production process.
Conclusion: from calculating OEE to using OEE
Calculating OEE is the first step. The real value is created when production teams, operators and maintenance teams use the same figures to determine where capacity is being lost and which improvement should receive attention first.
Start small. Choose one machine or production line, define your measurements clearly and measure consistently. Once the foundation is reliable, it becomes increasingly clear which stops, speed losses and quality issues are costing the most production capacity.
Do you want to go beyond calculating an OEE score after the shift and see what is changing the score while production is still running? Explore the live OEE dashboard from Meshnex, or connect one machine for free and see the OEE of your own line.