

MeshOS module
Live OEE dashboard for insight during the shift
Your OEE score tells you how effectively your machines and production lines are running, but once the shift is over that insight comes too late to act on. With the live OEE dashboard in MeshOS you follow availability, performance and quality per machine, line or shift while production is still running. So you don't find out tomorrow how today went.
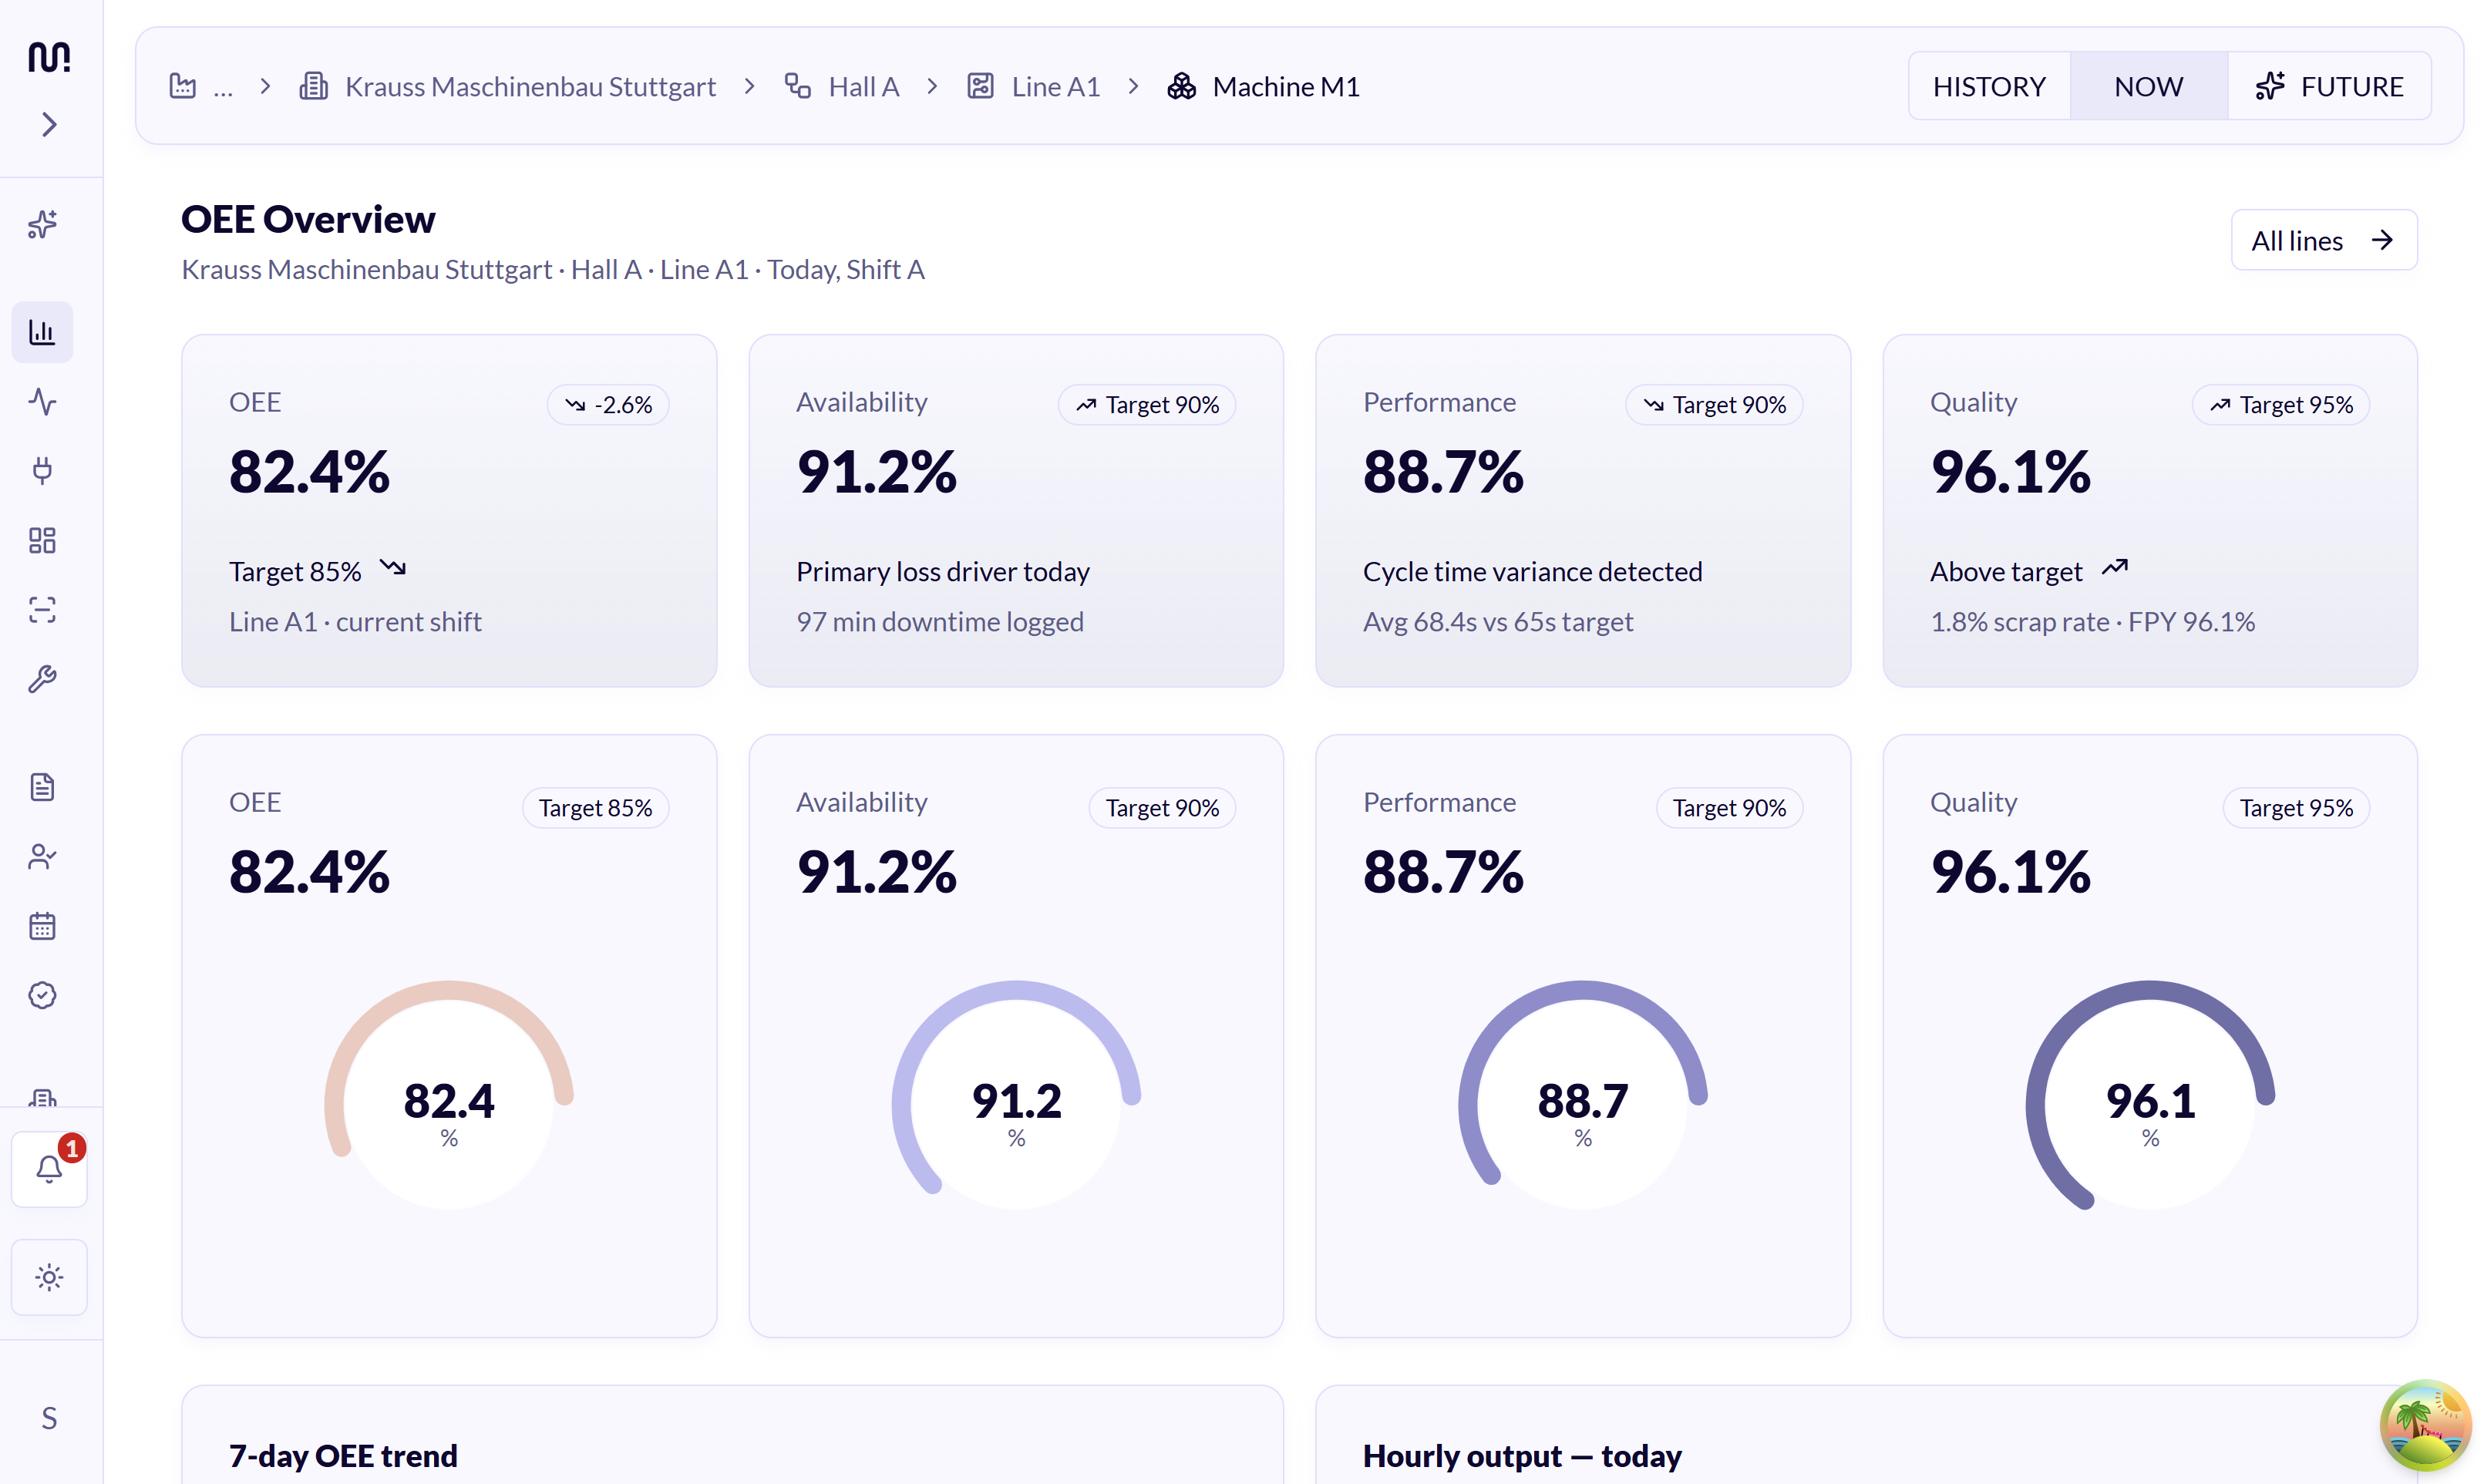
You know the OEE score. But do you know what changes it?
In many manufacturing companies OEE is calculated after the fact: data from different systems, operator registrations and Excel files is merged into one percentage. That does give a picture of performance, but often only once the shift is already over. As a result, important questions stay unanswered during the production day.
An OEE dashboard makes this information visible live. You don't just see the score, you see what is happening behind it.
In the dashboard
What do you see in the live OEE dashboard?
MeshOS reads data from existing machines, PLCs and other data sources and brings it together in one production dashboard. It gives you an up-to-date picture of performance on the factory floor.
Measure OEE while you can still act
Measuring OEE is most valuable when the information is available in time. A score that appears in a report the next morning helps with evaluation, but it no longer solves the previous shift's problem.
With live OEE monitoring, the production team sees during the shift:
That turns OEE from a reporting figure into a tool for daily production.
- When availability drops.
- When a line runs below the desired speed.
- When quality loss occurs.
- Where performance deviates from the norm.
- Which machine or line needs the most attention.
- Whether an intervention actually has effect.
Improving OEE starts with understanding where loss occurs
A low OEE score tells you that production capacity is being lost, but not yet what to improve first. That is why MeshOS shows not only the total percentage, but also the split between availability, performance and quality.
Looking at these components separately makes improving OEE concrete: you know which losses to investigate and which team to involve.
One production dashboard instead of scattered Excel files
When OEE is calculated manually, information comes from different sources. Operators log stops, production collects counts, quality registers rejects. Eventually the data is merged into a report or spreadsheet, and differences creep in easily:
MeshOS brings the available production data together in one up-to-date OEE system. Production, operators, maintenance and management all work with the same data.
- Data is missing.
- Registrations are interpreted differently.
- Information is already outdated.
- Shifts use different ways of working.
- Figures are adjusted afterwards.
- Not everyone looks at the same version.
Improve production efficiency with live insight
Improving production efficiency is not just about producing faster. It is mainly about making better use of the machines, time and capacity that are already available. A live OEE dashboard helps answer questions such as:
That way improvement actions are based on current data from your own factory floor, instead of on loose reports or assumptions. MeshOS does not improve OEE automatically: it makes visible where loss occurs and where your team can intervene.
- Where do we lose most of the planned production time?
- Which line structurally runs below the desired speed?
- When do most rejects occur?
- Which shift performs differently from the rest?
- Which change actually had effect?
- Where is the best opportunity to improve first?
For every role
One machine monitoring dashboard, for every role
Not everyone looks at OEE the same way. MeshOS uses the same production data, but can present it clearly per role. Every role looks at a different part, but uses the same foundation.
OEE software that works with your existing machines
You don't have to replace machines or introduce a completely new production system to start with live OEE. Meshnex places a pre-configured edge device at the machine, production line or PLC cabinet. MeshOS reads the available data from existing PLCs and data sources and turns it into usable production information. The connection to the factory floor is read-only: MeshOS reads data, but does not control machines.
That gives you OEE software that fits the existing factory, without major rebuilds or replacement.
From raw machine data to a clear OEE analysis
Machines produce data continuously, but raw PLC data is not usable production insight yet. MeshOS structures the available data and links it to the right machine, line, shift and event. The result is an OEE analysis that shows not just the final percentage, but also the context behind it. For example, you see:
That makes it easier to discuss improvement points and to re-evaluate actions later.
- When the score started to drop.
- Which OEE component caused the drop.
- Which machine or line was involved.
- Which alarms or deviations occurred at the same time.
- Whether the problem has occurred before.
- How performance compares to a previous shift or period.
Start with one machine or production line
You don't have to map the OEE of the whole factory right away. Start with one machine or production line whose performance you want to understand better.
Step 1: we connect the machine
Meshnex installs the edge device and connects MeshOS to the available PLCs and data sources.
Step 2: the first OEE dashboard goes live
Availability, performance, quality, machine status and other available production data become visible in one overview.
Step 3: you see what changes the score
Over the next shifts it becomes clear where production capacity is being lost and which patterns keep coming back.
Step 4: you expand where it delivers value
Once the dashboard delivers usable insights, you can expand to more machines, lines, departments or sites.
Proof in practice
Production insight in the field
Real projects on real factory floors.
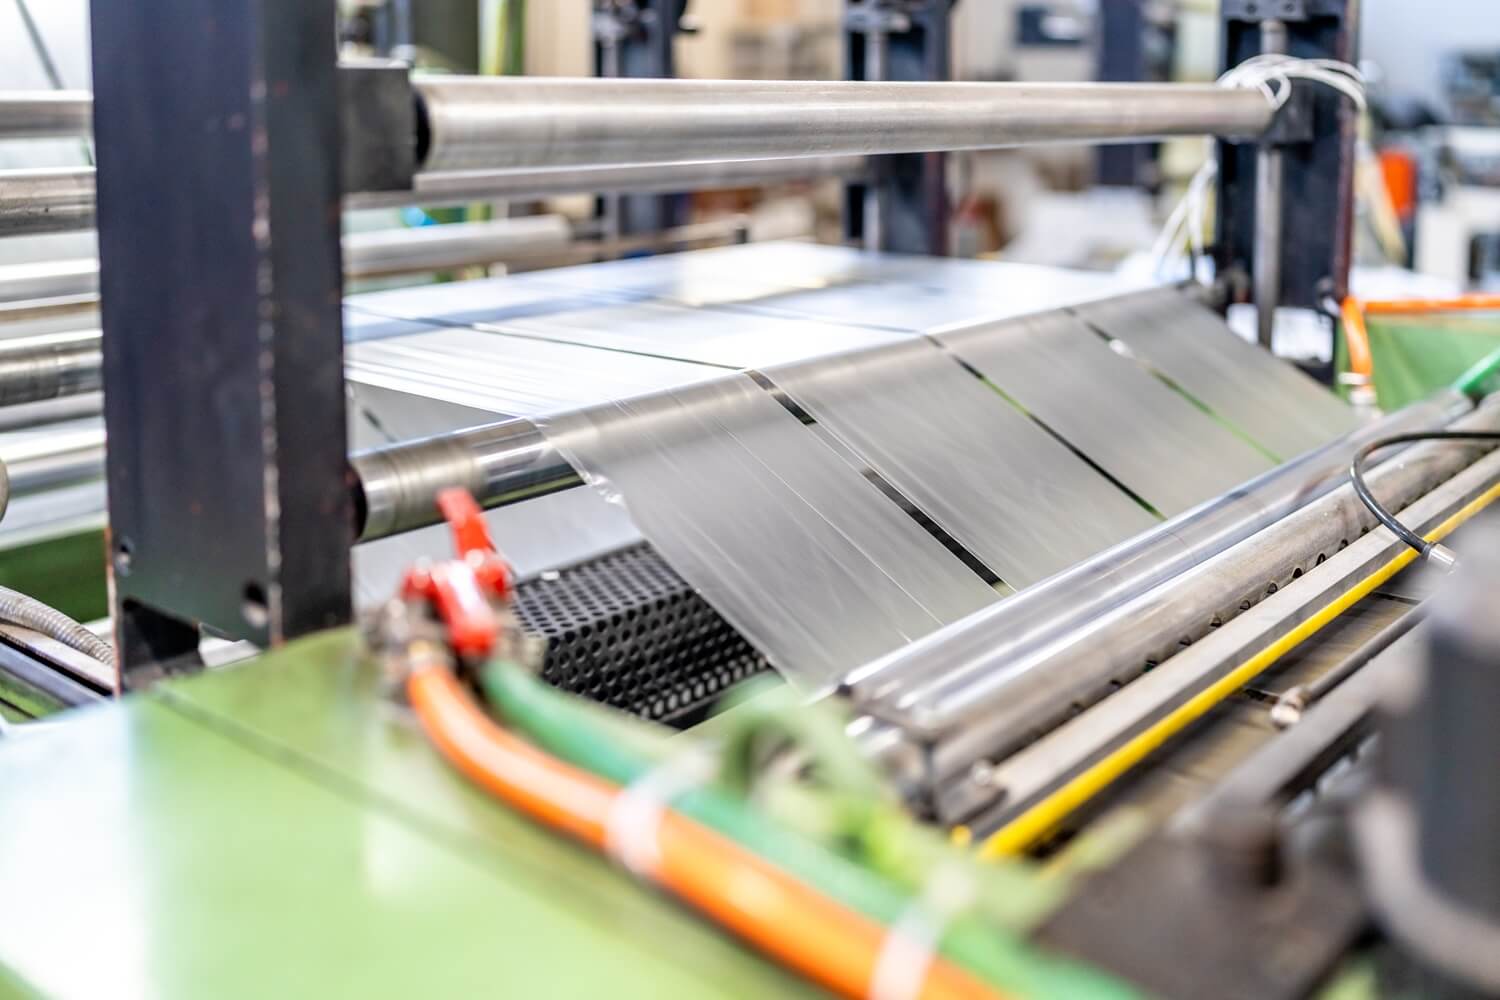 Downtime tracking
 Every stop on the line, counted and classified
Every stop is captured automatically from the PLC and classified: changeover, jam, starvation, microstop. A live Pareto shows where the shift actually went, so improvement starts at the biggest eater of capacity instead of a gut feeling.
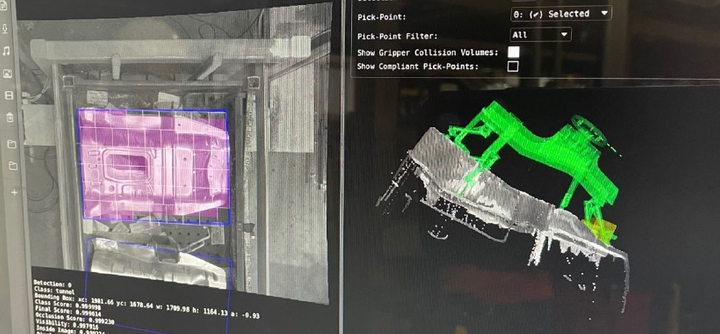 Quality early warning
 Scrap predicted before it comes off the line
Process parameters temperatures, pressures, cycle times feed a model that flags drift towards rejects while parts are still in the machine. Operators correct course instead of sorting scrap afterwards, and every intervention is logged against the batch.
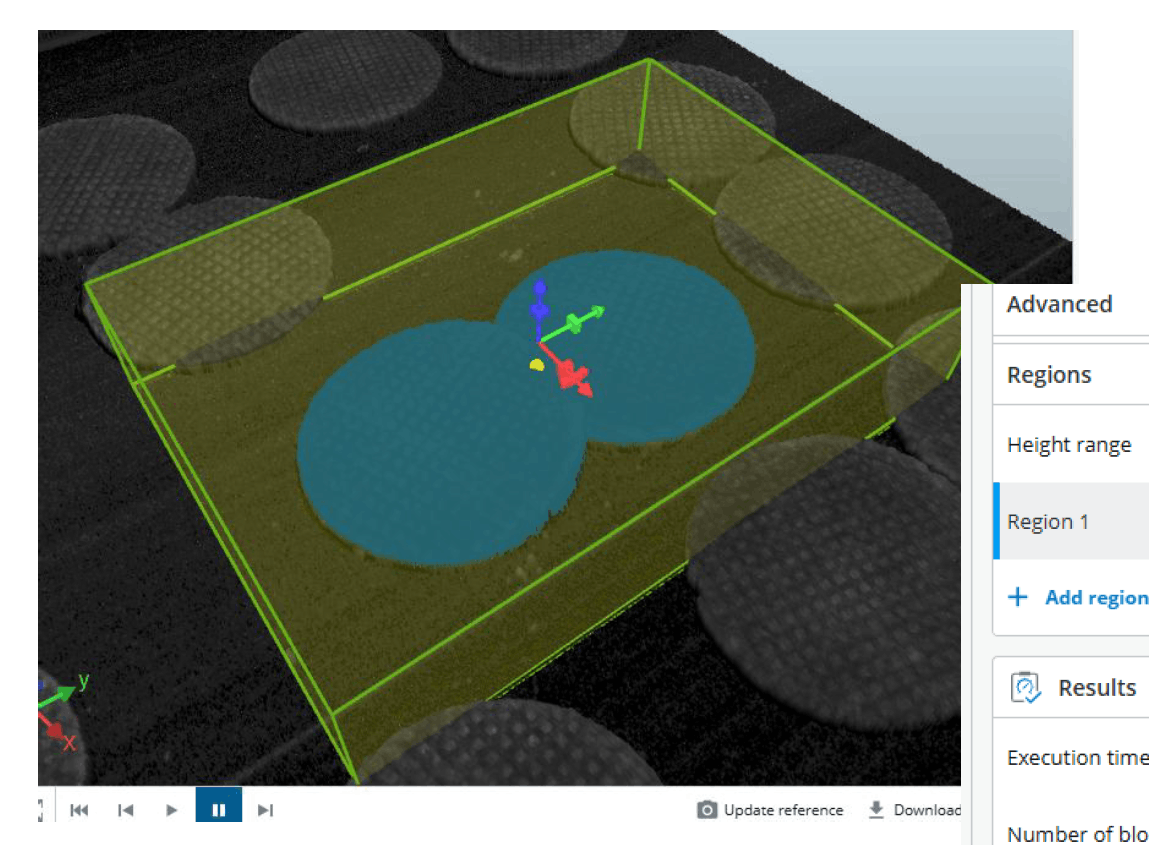 Inline quality inspection
 Every stroopwafel measured by a 3D laser camera
A 3D laser camera measures every stroopwafel on the line: diameter, thickness and shape. Deviations show up while the batch is still running, not at the sample check afterwards. All quality data logged per line and per batch.
Frequently asked questions about the OEE dashboard
What is an OEE dashboard?
An OEE dashboard is an overview that makes the Overall Equipment Effectiveness of machines or production lines visible. The OEE score is built up from availability, performance and quality. By showing these components together and separately, you see how effectively the available production time is being used.
What does OEE mean?
OEE stands for Overall Equipment Effectiveness. It is a measuring method that manufacturers use to look at the availability of machines, performance compared to the desired speed and the quality of the produced output. The combination of these three components forms the total OEE score.
Does MeshOS calculate OEE automatically?
MeshOS uses available machine data and production data to make the components of OEE visible. Which data is automatically available depends on the machines, PLCs, sensors and data sources on site. During onboarding we assess which information can be read out and how it should be set up.
Can we view OEE per machine and per production line?
Yes. MeshOS can show OEE and other production data at different levels, for example per machine, line or shift. Which breakdown fits best depends on the layout of the factory and the available data.
Is an OEE dashboard the same as a production dashboard?
An OEE dashboard focuses specifically on availability, performance and quality. A broader production dashboard can also show machine status, alarms, trends, changeovers and other production KPIs. Within MeshOS these insights can be brought together in the same platform.
Do operators have to enter data manually?
MeshOS is designed to pull as much data as possible directly from existing machines, PLCs and data sources. Whether additional manual input is needed depends on what information is technically available and what context you want to add.
Do we need new machines?
No. MeshOS is built to work with existing machines, PLCs and data sources. No full machine replacement or major rebuild is needed to start with a first dashboard.
Can we start with one machine?
Yes. You can start with one machine or line and first assess which data, performance and improvement opportunities become visible. After that, MeshOS can be expanded step by step.
How quickly can the dashboard be live?
In many situations the first live data can be visible within 48 hours of installation on site. The exact lead time depends on the available machines, data sources, network facilities and desired setup.
See how your production is performing
Your machines already produce the data. MeshOS brings it together in a live OEE dashboard that shows how availability, performance and quality develop during the shift. Start with one machine and discover where production capacity is being lost and where your team can improve.