

MeshOS · Energy management system
Know where every kilowatt-hour goes: per machine, per shift, per product
The main meter tells you what the factory used. It cannot tell you that the compressor room used a third of it, that the night shift runs the ovens hotter, or what one batch of product cost in energy. Energy monitoring in MeshOS puts meters on the consumers that matter and turns the readings into cost per line, shift and product while production is running. Start with one line and the meter it deserves.
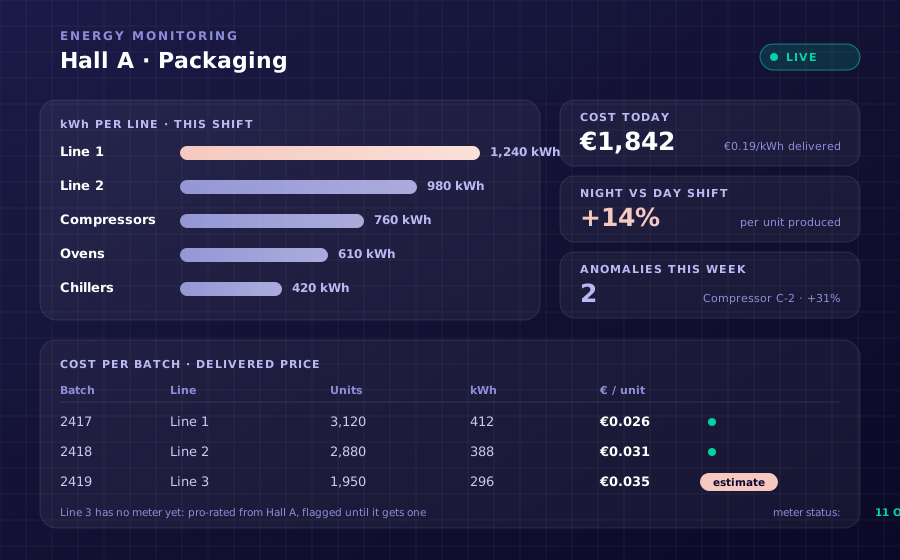
One meter, one invoice, no answers
Almost every factory has exactly one energy meter that matters: the one the grid operator reads. Everything behind it is a guess. That is why the questions that would actually save money go unanswered:
The answers need meters where the energy is used, and software that keeps every reading tied to the machine, the shift and the product it belongs to.
What you see once the big consumers are metered
MeshOS reads the meters over the network, stores every sample and keeps the site, area, line and machine hierarchy behind it. That is what makes a number usable rather than just available.
Where this fits
Energy monitoring is the measuring layer of one system
Everything on this page is the first of four stages. The same meters feed the forecast, the recommendations and the battery control described on the energy management system page.
Honest about sub-metering: what a number without a meter is worth
Not every machine will have its own meter on day one, and pretending otherwise is how energy dashboards lose trust. MeshOS handles the gap explicitly.
A machine without its own meter gets a share of its line or area meter, in proportion to what is known about it. That number is useful for a first comparison and useless for a quote. So:
The fix for an estimate is a meter, not a better formula. We tell you which machine earns one first.
- Every pro-rated number is flagged as an estimate, on the dashboard and in the export.
- A meter that has not reported for two minutes shows as stale, and its last value is not silently reused.
- Cost per unit only appears when both the energy and the produced units for that run are known.
- Units are checked at the source: a meter reporting watts is never displayed as kilowatts.
Who reads which number
Meters we install, meters you already have
Most sites start with the main meter and the meters the installer left behind: a Modbus meter in a distribution board, a PLC that already counts kWh.
Where the picture is missing, we fit Finder energy meters on the DIN rail of the main consumers: compressors, ovens, chillers, the lines that matter. Each meter connects over the network with its own device identity.
What you get in the first weeks:
Everything is read-only: monitoring never sends a command to a machine.
- The site's load curve against the contract, from the main meter.
- Live kW and daily kWh per metered consumer.
- The first anomaly alerts, once a baseline of a few weeks exists.
- kWh per batch as soon as the production schedule is connected.
Start with the line you argue about
Pick the line where the energy cost is disputed: the one the plant manager suspects and the shift leader defends. One meter settles it.
Step 1: we meter the main feed and one line
The edge device reads the main meter, and a Finder meter goes on the line's supply.
Step 2: the first shift comparison
Within a week you see the line's kWh per shift and per day next to its output.
Step 3: batches and products
Connect the production schedule and cost per batch and per unit appears, priced at delivered cost.
Step 4: more meters where the estimates hurt
Every estimate flag is a candidate for the next meter. Expand to the consumers where the guess costs the most.
Proof from the field
Energy monitoring in practice
Real meters, real dashboards.
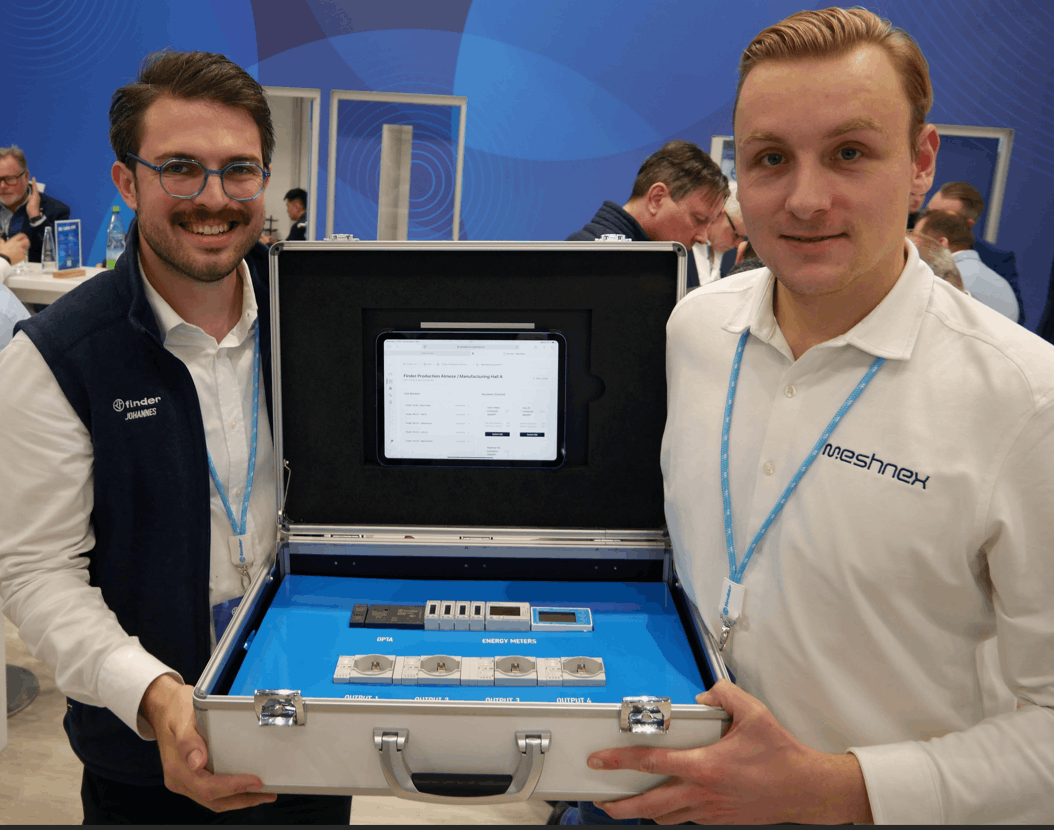 Energy monitoring
 Energy data that writes its own audit report
Sub-metering on the main consumers, one dashboard with kWh per line and per batch, and audit-ready ISO 50001 and CSRD reports generated from live data instead of a yearly spreadsheet scramble. The auditor's letter stopped being a fire drill.
Frequently asked questions about energy monitoring
Do we need a meter on every machine?
No. Start with the main meter and the five to ten consumers that make up most of the load. Machines without a meter get a pro-rated share, flagged as an estimate, until they earn a meter of their own.
Can you read the meters we already have?
Usually, yes. Modbus meters, PLC kWh counters and pulse outputs can be read by the edge device. What we cannot do is trust a meter whose units or scaling are unknown: those are verified before the readings count.
How is cost per product calculated?
Energy attributed to a production run (from the line or machine meter over the run's time window) times the delivered price of those hours, divided by the units produced in that run. If the machine is not metered, the number is an estimate and says so.
What is a delivered price?
What you actually pay per kWh in a given hour: the day-ahead spot price plus supplier margin, network variable charge, capacity-market fee in its window and excise. It is built from your own tariff, not a national average.
Does this replace our ISO 50001 or CSRD reporting?
It gives the measured basis for it: continuous kWh per line, area and batch with every estimate marked. Scope, boundaries and the report itself stay yours and your auditor's.
How soon do alerts become useful?
After a few weeks. An anomaly is a deviation from your own hour-by-weekday baseline, and that baseline needs history. A breach of the contract limit is flagged from day one, because that needs no baseline.
Which line do you want the number for?
Tell us which line's energy cost is disputed. We put a meter on it and you have the kWh per shift within a week.