

3D vision solution
3D quality control: every product measured against its design
Today you know the dimensions of a sample: a few products per hour, measured with calipers or on a CMM, long after they were made. With in-line 3D quality control a laser triangulation sensor captures every product as a 3D model at line speed and compares it with the design. You see diameter, thickness, flatness and volume drift while the batch is still running, and you correct the process instead of sorting rejects afterwards. Every measurement is logged per product and batch.
Measuring by sample tells you what a few products looked like an hour ago
In most factories dimensional control is still a sample: an operator takes a product off the line, measures it with calipers, a gauge or a CMM, and writes the number down. That works, until tolerances tighten, the line speeds up or the customer wants proof per product. Then the same problems come back.
This is not a diligence problem. In measurement system studies the operator's technique is usually the biggest source of spread, and visual checks by trained inspectors catch about 80% of deviations in repetitive work. A sample can only tell you about the sample.
Applications
What in-line 3D quality control measures
A laser triangulation sensor delivers a height value for every point on the product, not a picture. Software turns that into the measurements you actually control on, and compares the whole shape with the CAD model or a golden sample.
Bakery and food, CNC machining, PCB assembly, injection moulding, sheet metal and welding: the sensor is the same, the tolerances and the field of view are chosen for your product.
How laser triangulation works on your line
A laser projects a thin line across the product. A camera looks at that line from a fixed angle: where the product is higher, the line shifts in the image, and geometry turns that shift into a height for every point along the line. That is one profile. The conveyor's encoder triggers the next profile after a fixed distance, thousands of times per second, and stacking the profiles gives a full 3D model of every product that passes.
The measurement doesn't stay on a screen. It goes to the line and into the record:
That turns dimensional control from a sample after the fact into a fixed step in the process: every product measured, every measurement on record.
- Sensor, field of view and mounting are chosen for your tolerance: a few millimetres of field for micron work, over half a metre for large parts.
- Profiles are triggered by the conveyor encoder, so the measurement is correct at any belt speed.
- The evaluation runs locally on the edge computer, independent of the internet.
- Out-of-tolerance products are ejected or reported to the PLC: whatever fits your process.
- Every product is logged with its measurements, its 3D model and a timestamp, per order or batch.
- The sensor is mounted over your existing line, with a bandpass filter that makes it indifferent to plant lighting.
What 3D sees that a 2D camera cannot
A 2D camera judges contrast: colour, edges, print. A 3D sensor measures height. Which one you need depends on the question you are asking about the product.
Not sure which one your check needs? We determine that in the intake, based on your product, your tolerance and examples of the deviations you want to catch.
A measurement that ends in a reject bin is not yet a quality system
Plenty of 3D sensors do their job as an island: the product is out of tolerance, it is pushed off the belt, and that is the end of it. The number was measured, and then it was thrown away with the product. What stays behind:
That is why Meshnex writes every measurement into MeshOS: the same platform where your machine data, downtime and OEE already come together.
- Measurements stay on the sensor's screen at the line.
- A deviation is not linked to order, batch, cavity, tool or shift.
- You see the rejects, not the drift that preceded them.
- Nobody knows whether the process is running in the middle of the tolerance or on its edge.
- For a complaint or an audit, the search starts from scratch.
- The sensor keeps rejecting the same deviation forever, because nobody removes its cause.
From a height map to numbers you can steer on
Every product produces a record: measurements, deviation from the design, 3D model and timestamp, linked to line, order, batch and where relevant to cavity, tool or oven zone. In MeshOS those records sit next to your production data, and dimensional quality becomes a live process signal instead of an after-the-fact verdict.
For example, you see:
That is the difference between knowing you made rejects and knowing you are about to.
- Every dimension as a trend over the batch, with the tolerance limits drawn in.
- Control charts on 100% of the products instead of a sample of five per hour.
- Which cavity, tool, line or shift deviates, compared side by side.
- The 3D model behind every reject, ready for a complaint or an audit.
- Drift towards a limit, hours before the first product crosses it.
- Dimensional quality next to OEE and downtime: one picture of how the line performs.
Where it gets really interesting: steering the process while the batch runs
Catching rejects is the floor, not the goal. Because every product is measured and the trend is visible live, you can adjust the process before the limit is reached: the product stays inside tolerance and you stop giving away material to stay safely on the good side. Quality and product cost, optimised at the same time.
You don't stop at intercepting rejects: you run the process where it is cheapest and still in spec, and you can prove it per product.
Sectors
Three places where 3D quality control pays off first
The sensor is the same everywhere. What differs is the tolerance, the field of view and the number that hurts in your factory.
Injection moulding, sheet metal, welding and packaging follow the same pattern: measure everything, trend it, steer on it.
For every role
One measurement record, for every role
In-line 3D measurement touches more people than the quality department. MeshOS shows the same records, presented in a way that fits each role.
3D measurement that fits your existing line and IT
Sensor, encoder coupling and edge computer are mounted over the line that is already there: no new machines, no major rebuild. The evaluation happens locally at the line. Where the measurements and 3D models land is up to you:
That keeps product geometry within your own environment when it has to, and the solution meets your own IT and GDPR requirements.
Honest about 3D measurement: what it takes to make it work
Laser triangulation is proven, mature technology, but it has physics to respect. Three things decide whether an in-line 3D project succeeds, so we settle them in the intake.
That is why a new measurement point first runs alongside your existing checks without rejecting. Only when its numbers match your calipers and your CMM does the system get the final say over a product.
Start with one measurement point
You don't have to measure the whole factory in 3D at once. Start with the dimension that causes complaints, the giveaway that costs the most, or the CMM queue that holds up the machine.
Step 1: we define the dimensions and tolerances together
In the intake we pick the product and the check, take over the tolerances from the drawing or the spec and collect examples of the deviations you want to catch.
Step 2: sensor and edge computer on the line
We select sensor, field of view and mounting, couple the encoder, calibrate against a reference part and collect 3D data from real production.
Step 3: the measurement runs alongside
The point measures every product without rejecting. We compare its numbers with your calipers and CMM, tune the tolerances and check the trends against what the line actually did.
Step 4: go live and steer
The point measures and rejects on its own, trends and control charts come together in MeshOS, and you start correcting the process on the drift instead of on the rejects.
Proof in practice
In-line measurement in the field
Real measurement and quality projects on real factory floors.
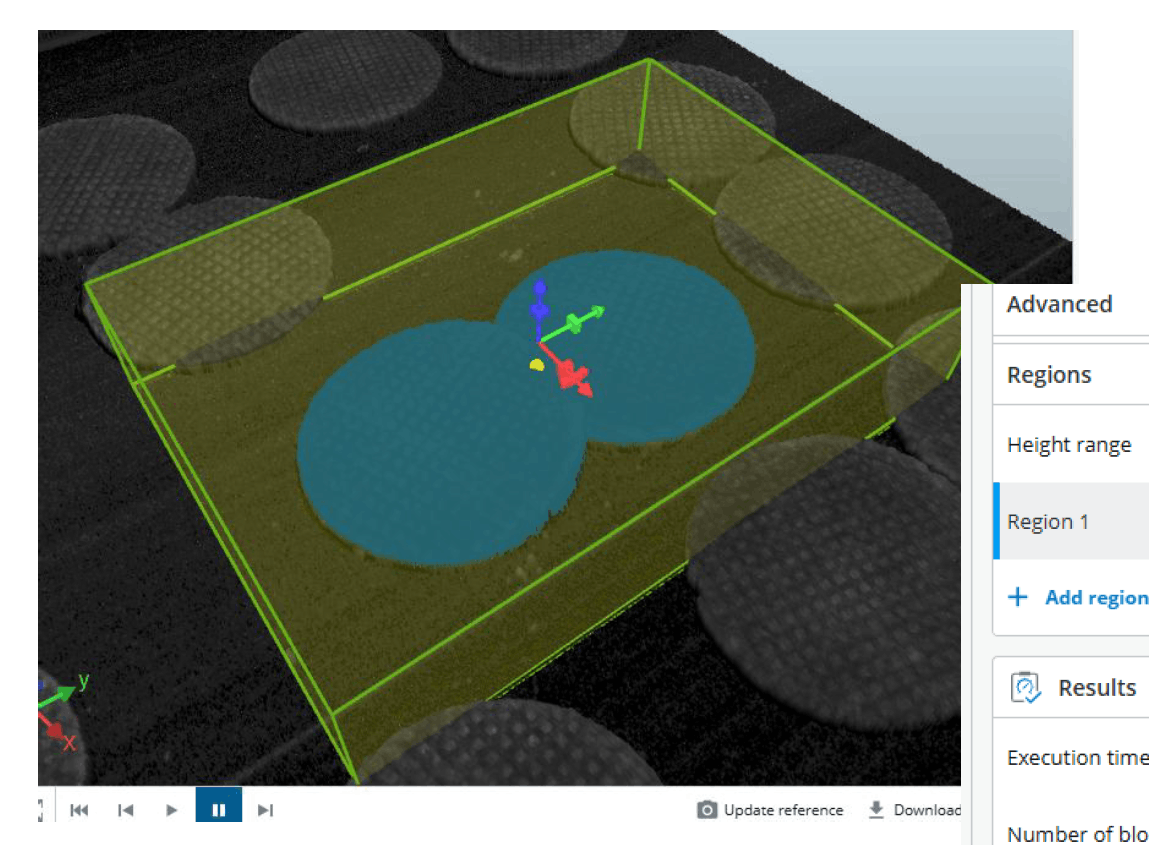
Inline quality inspection Every stroopwafel measured by a 3D laser camera
A 3D laser camera measures every stroopwafel on the line: diameter, thickness and shape. Deviations show up while the batch is still running, not at the sample check afterwards. All quality data logged per line and per batch.
 Quality early warning
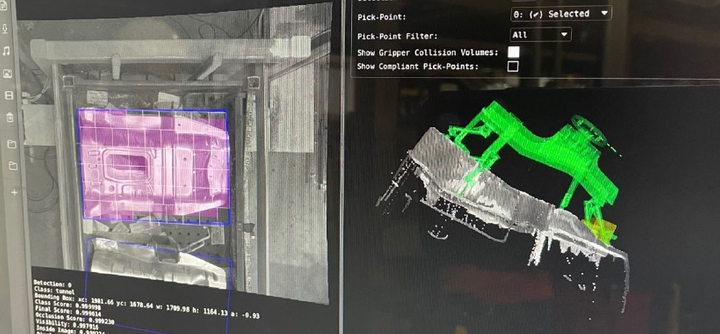
 Scrap predicted before it comes off the line
Process parameters temperatures, pressures, cycle times feed a model that flags drift towards rejects while parts are still in the machine. Operators correct course instead of sorting scrap afterwards, and every intervention is logged against the batch.
 Traceability
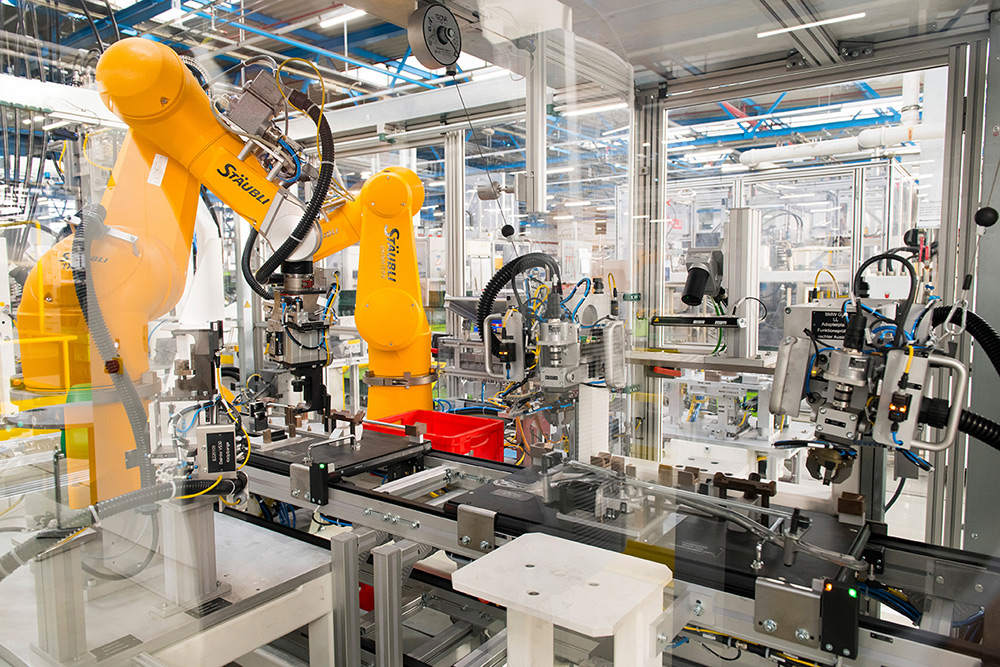
 Production data and traceability, from line to IT
Machine data and end-of-line test results securely unlocked into the IT landscape: segmented network, one central data layer, every product digitally traceable. Automotive requirements as the design principle.
Frequently asked questions about 3D quality control
What is in-line 3D quality control?
In-line 3D quality control measures every product on the line in three dimensions with a laser triangulation sensor and compares the result with the design or a golden sample. Dimensions, flatness, volume and shape are checked at line speed, out-of-tolerance products are rejected and every measurement is logged per product and batch. The trend over the batch shows drift before it becomes a reject.
How does a laser triangulation sensor work?
A laser projects a line across the product and a camera looks at it from a fixed angle. Where the product is higher, the line shifts in the image, and that shift is converted into a height for every point along the line. The conveyor's encoder triggers a new profile every fixed distance, thousands of times per second, and the profiles together form a 3D model of the product.
How accurate is in-line 3D measurement?
That depends on the field of view. On a field of a few millimetres, laser profilers reach repeatability well below a micron; on a field of half a metre it is tens to hundreds of microns. The rule of thumb from measurement system analysis is that the measurement spread should stay under 10% of the tolerance, and we select the sensor for that. What the point reaches on your product is verified against a reference part before it goes live.
What is the difference between 3D measurement and AI visual inspection?
3D measurement answers "how big, how flat, how much?" and needs no contrast: it measures height. AI visual inspection answers "is there a scratch, a stain, a wrong print?" and works on the image. Many products need both, and we combine them in one inspection point when the check requires it.
Does it work on shiny, dark or transparent products?
Sometimes. Polished metal, deep black rubber and glass are the hard cases for any laser sensor: the line is reflected away, absorbed or transmitted. Blue lasers, a different mounting angle or a second sensor head solve most of it. For products like these we run a test on real samples before we promise anything.
Can it keep up with our line speed?
Almost always. Laser profilers capture thousands of profiles per second and the encoder keeps the spacing correct at any belt speed. The trade-off is resolution along the belt: the faster the line, the further apart the profiles for a given sensor, and we choose the sensor so that the smallest deviation you care about is still captured.
Can we compare every product directly with the CAD model?
Yes. The 3D model of the product is aligned to the CAD model or a measured golden sample and the deviation is shown per point, with the tolerance from the drawing. For products without a CAD model, such as baked goods, the reference is the target shape you define: diameter, thickness, height and their limits.
How does this help reduce giveaway in food production?
By showing you where the batch average actually sits. Fill weight rules only require the batch average to be at least the nominal value, so most producers run comfortably above it to be safe. When every product's dimensions and volume are measured, you see the average and the spread live and can run closer to nominal without risk. The dough or material you stop giving away is the return on the sensor.
Is 3D in-line measurement useful for CNC machining?
Yes, especially where the CMM is the bottleneck. A first-article measurement on a CMM takes 30 to 60 minutes; an in-line sensor measures every part in one pass. Trending the dimensions per part shows tool wear as drift, so an offset is corrected before the first part is out of tolerance. The CMM keeps its role for reference measurements and certification.
What does it do for PCB assembly?
It measures what 2D optical inspection cannot: solder paste volume and height per pad, component coplanarity, lifted leads and board warpage. Solder paste volume is typically judged between 70% and 130% of the aperture volume, and 3D is the only way to measure it. Every board is logged by serial number, so a field failure can be traced back to its paste deposit.
How much does in-line 3D quality control cost?
That depends on the application: the required resolution and field of view, the number of sensor heads, the line speed and how the result has to reach your systems. That is why we start with an intake and one measurement point, so the investment and the expected return in scrap, rework and giveaway are clear before you scale.
How quickly can a first measurement point go live?
In many cases a first point is on the line within 6 to 8 weeks, including mounting, calibration, setting the tolerances and a period of measuring alongside your existing checks. Difficult surfaces or very tight tolerances can add a test phase on real samples first.
Find out which dimension on your line is worth measuring on every product
Every product that leaves tolerance costs more than the sensor that would have seen it drift. Start with one measurement point for the dimension that matters most right now, and see for yourself what the trend tells you that the sample never did.